I love IPython notebook. The REPL nature with persistence of richly formatted output, plotting, remote notebooks, markdown comments/thoughts/explanations interspersed with code, and so much more. It all wonderfully comes together and elevates my ability to think through new problems and new domains to a whole new level. Then I learned about the IPython.display module …
Ho…
Ly…
$#\-/-
I can just render arbitrary HTML in a cell using python (WHAT?). I was ecstatic for a myriad of reasons, but the best one was the fact that it gave me a much better avenue for displaying images. Allow me to explain with an example. Here’s a standard matplotlib imshow command rendered inline:
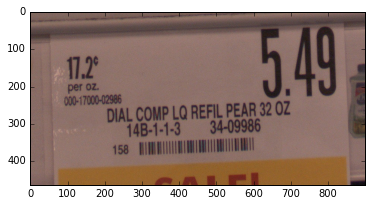
See the axis? They are some times very helpful (they allow me to understand the locations of certain elements in images) but other times they’re just a pain. An eye sore even. I kind of hate them… like … a lot. So instead of a standard plt.imshow..., now I can just use this instead and get rid of the axis.
from IPython.display import display, HTML
def display_opencv_image(im):
    encoded = cv2.imencode('.png', im)[1]
    base64String = encoded.tostring().encode('base64')
    display(HTML('<img src="data:image/png;base64,%s" width=300px></img>'%base64String))
So what’s going on there?
I’m just rendering an HTML img tag where the src field gets a data URL which is just the image encoded in the PNG format (using imencode) and the resulting bytearray converted into a Base64 encoded string which is a way to store binary data using a very limited set of characters (the alphabet, digits, and a couple of special characters).
Aaand yeah, that’s about it. We can now embed these images into the notebook, and even get fancier. One example (which is shittier than it should be) could be:
def display_opencv_image_with_rect(im):
    encoded = cv2.imencode('.png', im)[1]
    base64String = encoded.tostring().encode('base64')
    display(HTML('<svg height=1000 width=1000><image width="{}" height="{}"'
    'xlink:href="data:image/png;base64,{}"></image><rect x=600 y=30 width=250 '
    'height=210 style="fill: none; stroke: rgb(0, 255, 0); stroke-width: 5"/></svg>'.format(im.shape[1], im.shape[0], base64String)))
Which draws a rectangle around a certain part of the image like so:
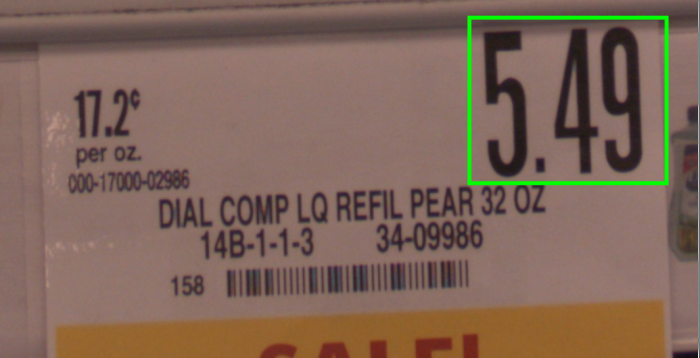
Which I think is much better for visualization compared to the OpenCV way because we don’t mess with the source image at all.
Where to go from here:
There’s a lot more to that module. You can:
- Add audio
- Run Javascript
- Render Latex
- Open a PDF
And a bunch more. I may cover some here at some point.
